
Introduction
Your app loads slowly. Users close it and never return. This scenario plays out thousands of times daily across mobile devices worldwide.
App performance isn't just a technical concern—it's a business-critical factor that directly impacts your bottom line. Studies show that 53% of users abandon mobile apps that take longer than three seconds to load. Even a one-second delay in response time can result in a 7% reduction in conversions.
The connection between app performance and business success is undeniable. Faster apps lead to higher user engagement, better retention rates, and increased revenue. Companies that invest in app performance optimization see measurable improvements in customer satisfaction scores and lifetime value metrics.
Performance issues don't just frustrate users—they damage your brand reputation and waste your marketing budget. You might spend thousands attracting users to your app, only to lose them within seconds due to poor performance. This makes optimization not just a technical necessity but a strategic business investment.
At Vohrtech, we've helped businesses across Montreal and beyond transform sluggish applications into high-performing digital experiences. Our evidence-based approach combines technical expertise with business understanding to deliver measurable results.
This comprehensive guide covers essential app performance optimization techniques that drive real results. We'll explore everything from measuring performance metrics to implementing code-level improvements, network optimization, and ongoing testing strategies. Whether you're managing an existing app or planning a new one, these proven techniques will help you build faster, more reliable applications that users love.
Understanding App Performance Metrics
You can't improve what you don't measure. This fundamental principle applies perfectly to app performance optimization.
Before diving into optimization techniques, you need to establish clear metrics that define success. Performance measurement provides the baseline data necessary to identify problems, track improvements, and justify optimization investments to stakeholders.
Key Performance Indicators to Track
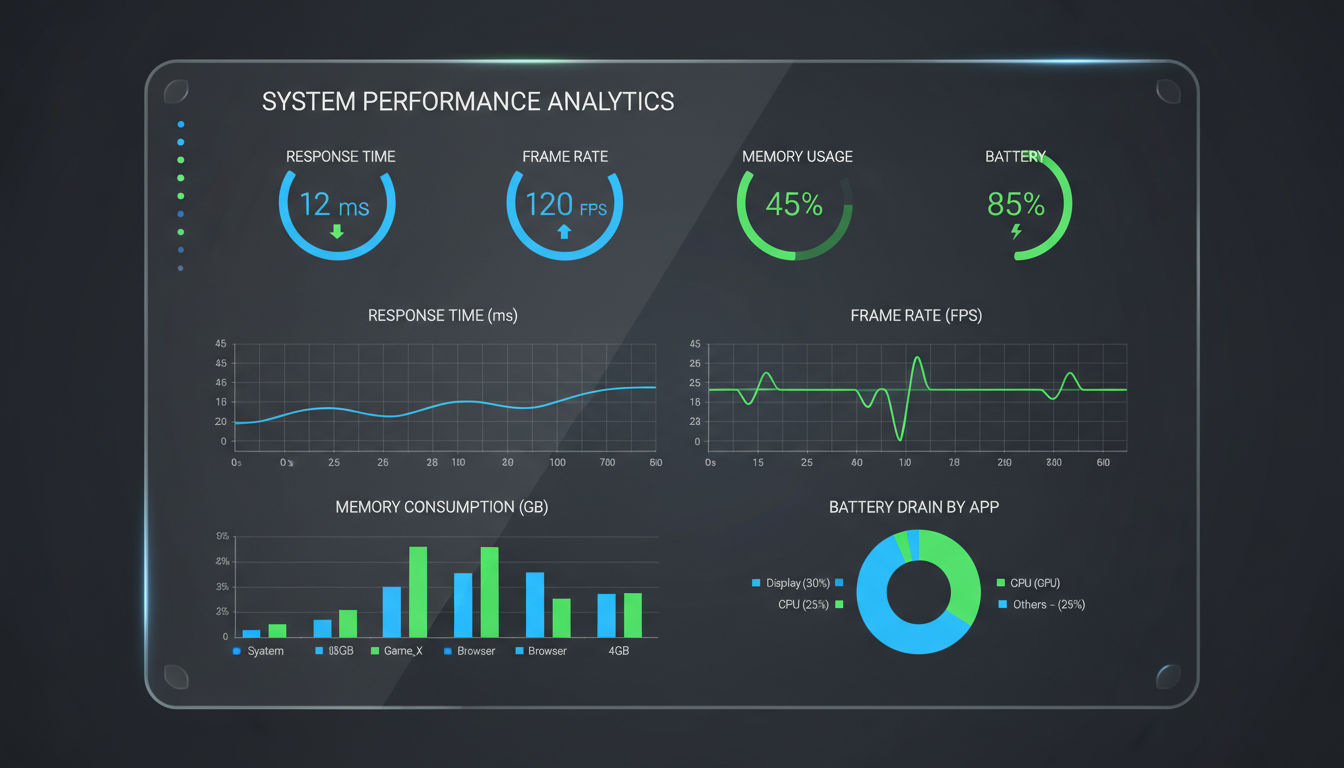
Several critical metrics determine whether your app delivers a satisfactory user experience. Response time measures how quickly your app reacts to user actions—this should typically stay under one second for most interactions. Startup time tracks how long users wait before they can actually use your app, with industry benchmarks suggesting three seconds or less for optimal retention.
Frame rate directly impacts perceived smoothness, especially for apps with animations or scrolling content. Your target should be 60 frames per second (FPS) to ensure fluid motion that feels natural to users. Anything below 30 FPS becomes noticeably choppy and frustrating.
Memory usage determines how efficiently your app utilizes device resources. High memory consumption can cause crashes, slow down other apps, and drain battery life. Network latency measures the delay in data transmission between your app and servers, while crash rate indicates overall stability—aim to keep this below 1% of sessions.
Battery consumption has become increasingly important as users grow more conscious of apps that drain their devices. An app that significantly impacts battery life will quickly find itself uninstalled, regardless of its other merits.
Establishing Your Performance Baseline
Start by measuring your current performance across all key metrics. Use real devices representing your user base—don't rely solely on emulators or high-end development machines. Your users likely have older devices with less processing power and memory.
Document performance across different scenarios: cold starts versus warm starts, various network conditions, and different data loads. This comprehensive baseline reveals where problems exist and helps prioritize optimization efforts.
Compare your metrics against industry benchmarks and direct competitors. Understanding where you stand in the market provides context for setting realistic improvement goals. A Montreal e-commerce client we worked with discovered their app loaded 40% slower than competitors, directly correlating with their higher-than-average cart abandonment rate.
Performance Monitoring Tools
Modern development ecosystems offer robust tools for tracking app performance. For iOS development, Xcode Instruments provides detailed profiling capabilities for CPU usage, memory allocation, network activity, and energy consumption. Android developers can leverage Android Profiler within Android Studio for similar insights.
Third-party platforms like Firebase Performance Monitoring, New Relic Mobile, and AppDynamics offer cross-platform tracking with real-time alerts and historical trend analysis. These tools automatically collect data from production apps, revealing how real users experience your application.
Google Analytics for Firebase and similar analytics platforms help correlate performance metrics with user behavior and business outcomes. You can see exactly how load times affect conversion rates, retention, and revenue.
Setting Realistic Performance Goals
Your performance goals should balance technical feasibility with business requirements. Not every app needs sub-second response times for every action, but user-facing interactions should always feel instantaneous.
Consider your specific use case and user expectations. A social media app requires faster performance than a reference application users access occasionally. Gaming apps need consistent frame rates, while productivity apps prioritize data reliability over speed.
Set incremental improvement targets rather than attempting perfection immediately. Reducing startup time from eight seconds to five seconds might be more achievable and impactful than aiming for one second right away. Document your goals clearly and tie them to business metrics that stakeholders understand—like increased user retention or higher conversion rates.
Code-Level Optimization Strategies

Clean, efficient code forms the foundation of any high-performing application. While infrastructure and network optimization matter, poorly written code will sabotage performance regardless of external improvements.
Code-level optimization requires careful analysis and strategic refactoring. The goal isn't just making code run faster—it's about writing smarter code that accomplishes more with fewer resources.
Implementing Efficient Algorithms
Algorithm choice dramatically impacts performance, especially when processing large datasets. A poorly chosen algorithm can turn a millisecond operation into a multi-second bottleneck.
Consider time complexity when selecting algorithms. An O(n²) algorithm might work fine with ten items but becomes unusable with thousands. Replace nested loops with more efficient approaches like hash tables or binary search where appropriate. One client's app processed user data with nested loops, taking 12 seconds to load a feed. Switching to a hash-based lookup reduced this to under one second.
Avoid premature optimization, but don't ignore obvious inefficiencies. Profile your code to identify actual bottlenecks rather than optimizing based on assumptions. The 80/20 rule typically applies—20% of your code accounts for 80% of performance issues.
Memory Management Best Practices
Memory leaks and inefficient memory usage cause apps to slow down over time and eventually crash. Proper memory management ensures your app runs smoothly throughout extended sessions.
Release objects and resources when they're no longer needed. In languages with manual memory management, ensure every allocation has a corresponding deallocation. Even in garbage-collected languages like Java or Swift, you can create memory leaks through strong reference cycles.
Use weak references for delegates and callbacks to prevent retain cycles. Implement proper cleanup in view controllers, activities, and fragments when they're destroyed. Monitor memory usage during testing, especially during navigation between screens and after repeated operations.
Optimize image and asset loading by loading only what's immediately needed. Don't keep large objects in memory when users navigate away from the screens that need them. Implement memory warnings handlers that release cached data when the system requests it.
Reducing Code Complexity and Redundancy
Complex, redundant code is harder to maintain and typically slower to execute. Simplification often improves both performance and code quality.
Eliminate duplicate code through proper abstraction and reusable functions. Each time you copy-paste code, you create maintenance burden and potential performance issues. Extract common functionality into well-designed utility classes or modules.
Quick question
Want to turn this into a real plan?
If you want expert help with strategy, design, development, marketing, or automation — we’ll recommend the fastest path forward for your goals.
Reduce conditional complexity by replacing long if-else chains with more efficient structures like switch statements, strategy patterns, or lookup tables. Deeply nested conditionals slow execution and make code harder to understand and optimize.
Remove dead code that no longer serves any purpose. Unused imports, commented-out sections, and deprecated functions add to your app's size and compilation time without providing value.
Asynchronous Processing Techniques
Blocking the main thread is the most common cause of unresponsive user interfaces. Any operation taking more than a few milliseconds should run asynchronously.
Move network requests, database queries, file I/O, and complex calculations to background threads. This keeps your UI responsive while work happens behind the scenes. Use appropriate threading mechanisms for your platform—Grand Central Dispatch for iOS, Kotlin coroutines or RxJava for Android.
Implement proper thread synchronization to avoid race conditions and data corruption. Use thread-safe data structures or synchronization primitives when multiple threads access shared resources.
Consider using reactive programming patterns for complex asynchronous workflows. Libraries like RxSwift or RxJava provide powerful abstractions for handling asynchronous data streams, though they require learning new concepts.
Performance Tuning Through Refactoring
Regular refactoring keeps code maintainable and performant. As requirements evolve, yesterday's optimal solution might become today's bottleneck.
Profile your app regularly to identify performance regressions. Automated performance testing can catch slowdowns before they reach production. At Vohrtech, we integrate performance profiling into continuous integration pipelines, ensuring every code change maintains acceptable performance standards.
Refactor hot paths—code sections executed frequently or during critical user interactions. Even small improvements in frequently-called functions compound into significant overall gains.
Balance readability with performance. Highly optimized code that nobody understands creates maintenance problems. Aim for code that's both efficient and comprehensible, using comments to explain non-obvious optimizations.
Network and API Optimization

Network operations represent one of the biggest performance bottlenecks in modern applications. Even fast code can't compensate for slow or excessive network requests.
Users increasingly expect apps to work seamlessly across varying network conditions—from high-speed WiFi to spotty mobile connections. Network optimization ensures your app performs acceptably regardless of connection quality.
Minimizing API Calls and Request Sizes
Every network request introduces latency, battery drain, and potential failure points. Reducing the number and size of requests directly improves perceived performance.
Batch related requests when possible instead of making multiple separate calls. If your app needs to fetch user profile data, posts, and notifications, consider combining these into a single API endpoint that returns all needed data. This reduces round-trip latency and connection overhead.
Implement pagination for large datasets rather than loading everything at once. Load initial content quickly, then fetch additional items as users scroll. This creates the perception of speed while managing data efficiently.
Use GraphQL or similar technologies that let clients request exactly the data they need. REST APIs often return more data than necessary, wasting bandwidth and processing time. One of our Montreal-based clients reduced their average response payload by 60% by switching from REST to GraphQL, significantly improving load times on mobile networks.
Compress request and response payloads using gzip or Brotli compression. Most modern servers and HTTP clients support automatic compression, reducing bandwidth usage by 70-90% for text-based data like JSON.
Implementing Effective Caching Strategies
Caching eliminates unnecessary network requests by storing previously fetched data locally. Proper caching can transform user experience, especially for frequently accessed content.
Implement multi-level caching strategies. Memory caching provides instant access to recently used data, while disk caching persists data across app sessions. Use appropriate cache expiration policies based on content freshness requirements.
Cache API responses with appropriate TTL (time-to-live) values. Static content like user avatars or product images can be cached for hours or days, while dynamic content like news feeds might need shorter cache durations.
Use HTTP caching headers properly. ETags and Last-Modified headers enable conditional requests that only download content when it's changed. This reduces bandwidth while ensuring users see current data.
Implement offline-first architectures where appropriate. Apps that cache data aggressively and sync changes when connectivity improves provide excellent user experience even with unreliable networks.
Data Compression Techniques
Beyond HTTP-level compression, consider compressing data within your app and APIs. This becomes especially important for apps handling large datasets or operating in bandwidth-constrained environments.
Use efficient serialization formats. JSON is human-readable but verbose—consider Protocol Buffers or MessagePack for binary serialization that significantly reduces payload sizes. These formats also parse faster than JSON, providing double performance benefits.
Compress images before uploading them from the app. Users don't need to upload full-resolution photos for profile pictures or posts. Client-side compression reduces upload times and server storage costs.
Implement delta synchronization for data that changes incrementally. Instead of downloading entire datasets repeatedly, only transfer what's changed since the last sync. This approach works particularly well for apps with large local databases that sync with servers.
CDN Integration for Faster Content Delivery
Content Delivery Networks distribute your static assets across geographically dispersed servers, reducing latency by serving content from locations closer to users.
Serve images, videos, stylesheets, and other static assets through CDNs rather than your origin servers. CDNs provide better performance, reliability, and bandwidth capacity than single-server setups.
Use CDN features like automatic image optimization that serve appropriately sized images based on device characteristics and network conditions. This eliminates the need to manually create multiple image variants.
Implement proper cache control headers so CDNs can effectively cache your content. Balance cache duration with the need for content freshness—longer cache times improve performance but may delay updates reaching users.
Handling Network Failures Gracefully
Network failures are inevitable. Apps must handle them gracefully rather than frustrating users with cryptic error messages or frozen interfaces.
Implement exponential backoff for failed requests. Immediately retrying failed requests can overwhelm servers and drain batteries. Wait progressively longer between retry attempts, giving temporary issues time to resolve.
Provide meaningful feedback when network operations fail. Users should understand what went wrong and what they can do about it. Generic "network error" messages don't help—explain whether the issue is connectivity, server problems, or something else.
Queue operations when offline and automatically retry them when connectivity returns. This creates a seamless experience where users can continue working without worrying about network status.
Show cached content with appropriate indicators rather than blank screens during network issues. Users prefer seeing slightly outdated content over nothing at all.
Image and Media Optimization
Images and media files typically represent the largest portion of app data transfer and storage. Optimizing these assets dramatically improves load times, reduces bandwidth costs, and enhances user experience.
Visual content is essential for engaging apps, but unoptimized media can cripple performance. Smart optimization maintains visual quality while minimizing file sizes and load times.
Image Compression and Format Selection
Choosing the right image format and compression level balances quality with file size. Different formats excel in different scenarios.
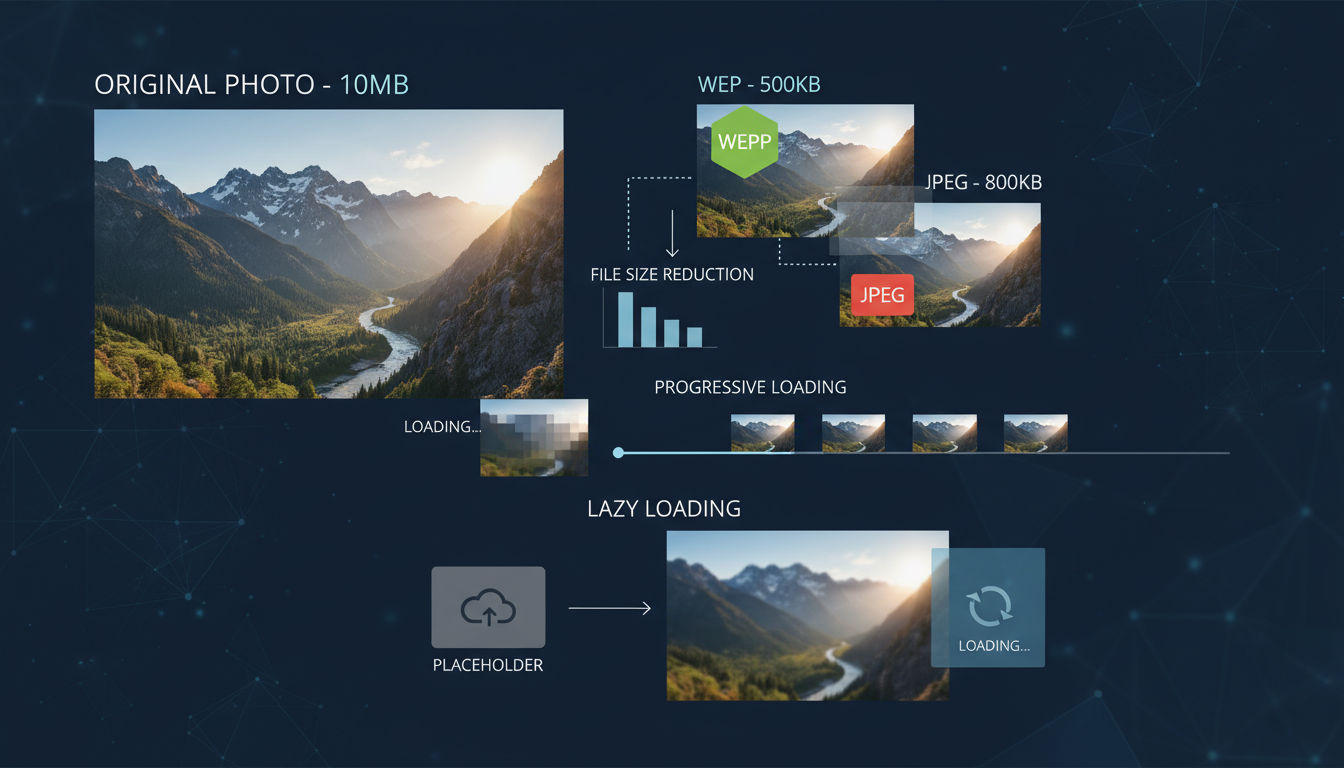
Use WebP format when possible—it provides superior compression compared to JPEG and PNG while maintaining quality. WebP images are typically 25-35% smaller than equivalent JPEGs. Most modern mobile platforms support WebP natively.
JPEG remains ideal for photographs and complex images with many colors. Use progressive JPEG encoding so images load gradually, showing a low-quality preview that sharpens as more data arrives. This creates better perceived performance than standard baseline JPEGs.
PNG works best for images requiring transparency or containing text, logos, and graphics with sharp edges. Use PNG-8 for simple graphics with limited colors and PNG-24 only when you need full color depth with transparency.
Apply appropriate compression levels. Maximum compression creates smaller files but may introduce visible artifacts. Test different compression levels to find the sweet spot where quality remains acceptable while file size decreases significantly.
Lazy Loading Implementation
Lazy loading defers loading images until they're actually needed, dramatically reducing initial load times and bandwidth usage.
Load above-the-fold content immediately while deferring below-the-fold images until users scroll toward them. This prioritizes visible content and creates the perception of instant loading.
Implement placeholder strategies that show low-quality image previews or solid colors while full images load. This prevents layout shifts and gives users immediate visual feedback.
Use intersection observers or scroll listeners to detect when images are about to enter the viewport. Start loading slightly before images become visible to ensure they're ready when users need them.
Consider loading thumbnail versions first, then replacing them with full-resolution images once loaded. This progressive enhancement approach ensures users see something quickly while better quality loads in the background.
Video Streaming Optimization
Video content requires special consideration due to large file sizes and bandwidth requirements. Proper optimization makes video practical even on mobile networks.
Implement adaptive bitrate streaming using protocols like HLS (HTTP Live Streaming) or DASH (Dynamic Adaptive Streaming over HTTP). These protocols automatically adjust video quality based on available bandwidth, preventing buffering while maximizing quality.
Provide multiple resolution options so users on slower connections can choose lower quality for smoother playback. Auto-selection should default to appropriate quality based on detected connection speed.
Use efficient video codecs like H.264 for broad compatibility or H.265 (HEVC) for better compression on newer devices. Consider VP9 or AV1 for even better compression, though device support varies.
Preload only essential video data—typically the first few seconds—rather than downloading entire files. Let videos load progressively as users watch, minimizing initial wait times.
Adaptive Media Delivery Based on Connection Speed
Different network conditions require different optimization strategies. Detecting connection quality and adapting content delivery ensures optimal experience across scenarios.
Detect network type (WiFi, 4G, 3G) and adjust media quality accordingly. Serve high-resolution images and videos on WiFi while providing compressed alternatives on cellular connections.
Monitor actual download speeds rather than just connection type. A congested WiFi network might perform worse than a good LTE connection. Adjust quality based on measured performance.
Implement data saver modes that users can enable to minimize bandwidth usage. This feature is especially valuable for users with limited data plans or traveling internationally.
Consider user preferences and past behavior. If users consistently choose high-quality options despite slower connections, respect their preference while providing clear feedback about longer load times.
Database and Storage Optimization
Efficient data storage and retrieval directly impacts app responsiveness. Database operations happen constantly as users interact with your app, making optimization critical for maintaining performance.
Poor database design creates bottlenecks that worsen as data volumes grow. Implementing proper optimization techniques ensures your app remains fast regardless of database size.
Query Optimization Techniques
Database queries represent frequent operations that compound into significant performance impacts. Optimizing queries reduces load times and improves responsiveness.
Retrieve only necessary columns rather than using SELECT * queries. Fetching unused data wastes processing time and memory. Specify exactly which fields you need for each operation.
Limit result sets appropriately using LIMIT clauses and pagination. Loading thousands of records when displaying ten creates unnecessary overhead. Fetch additional results only when users request them.
Avoid N+1 query problems where you execute one query to fetch a list, then additional queries for each item. Use JOIN operations or batch queries to fetch related data efficiently in fewer database round-trips.
Use prepared statements for repeated queries. Prepared statements are pre-compiled and reused, reducing parsing overhead and improving security by preventing SQL injection.
Filter data at the database level rather than fetching everything and filtering in application code. Databases are optimized for data filtering—use WHERE clauses effectively to minimize data transfer.
Indexing Strategies for Faster Data Retrieval
Database indexes dramatically speed up queries by creating efficient lookup structures. Without proper indexes, databases must scan entire tables to find matching records.
Create indexes on columns frequently used in WHERE clauses, JOIN conditions, and ORDER BY statements. These operations benefit most from indexing, often reducing query times from seconds to milliseconds.
Use composite indexes for queries filtering on multiple columns. A composite index on (user_id, created_at) optimizes queries filtering by both fields more effectively than separate indexes.
Avoid over-indexing, which slows down INSERT, UPDATE, and DELETE operations. Each index must be maintained when data changes. Balance read performance with write performance based on your app's usage patterns.
Monitor index usage and remove unused indexes. Indexes consume storage space and maintenance overhead. Many databases provide tools showing which indexes are actually being used by queries.
Local Storage Best Practices
Mobile apps often store significant data locally for offline access and performance. Managing this storage efficiently prevents bloat and maintains responsiveness.
Use appropriate storage mechanisms for different data types. Key-value stores like UserDefaults (iOS) or SharedPreferences (Android) work well for simple settings. SQLite databases suit structured relational data. File storage handles binary content like images and documents.
Implement storage quotas and cleanup policies. Apps that accumulate unlimited cached data eventually consume excessive device storage and slow down. Regularly purge old cached content based on age or usage frequency.
Compress data before storing it locally when appropriate. Text-based data compresses well, significantly reducing storage requirements. Balance compression benefits against the CPU cost of compression/decompression.
Use background threads for database operations. Reading and writing large amounts of data can block the main thread, freezing your interface. Perform storage operations asynchronously to maintain responsiveness.
Data Synchronization Efficiency
Apps that sync data between devices and servers must do so efficiently to avoid draining batteries and wasting bandwidth.
Implement incremental synchronization that transfers only changed data rather than entire datasets. Track modification timestamps or version numbers to identify what needs syncing.
Batch synchronization operations rather than syncing after every change. Collect changes locally and sync them periodically or when users trigger manual sync. This reduces network overhead and battery consumption.
Use conflict resolution strategies for data modified on multiple devices simultaneously. Implement last-write-wins, merge strategies, or user-prompted resolution depending on your data characteristics.
Sync intelligently based on network conditions and device state. Avoid large syncs on cellular connections or when battery is low. Schedule intensive sync operations for when devices are on WiFi and charging.
Mobile App Performance Testing Methods

Testing validates that optimization efforts actually improve performance. Without systematic testing, you're guessing whether changes help or harm user experience.
Comprehensive testing catches performance regressions before they reach users. It also provides the data needed to prioritize optimization work and demonstrate improvements to stakeholders.
Real Device vs. Emulator Testing
Emulators and simulators provide convenient testing environments, but they don't accurately represent real-world performance. Real device testing is essential for meaningful results.
Test on actual devices representing your user base. Check analytics to identify the most common devices, operating system versions, and screen sizes among your users. Prioritize testing on these configurations.
Include older, lower-end devices in your test matrix. High-end development machines and flagship phones mask performance problems that affect most users. An app running smoothly on the latest iPhone might struggle on a three-year-old Android device.
Next step
Ready for a quote and timeline?
Send a quick note with what you’re building, your deadline, and what success looks like — we’ll reply with clear next steps.
Emulators remain valuable for rapid iteration during development. Use them for quick testing cycles, but always validate on real hardware before considering work complete. Emulators can't accurately simulate memory constraints, thermal throttling, or real network conditions.
Test under realistic conditions including low battery states, limited storage, and background processes. Performance often degrades when devices are stressed by multiple running apps or low resources.
Load and Stress Testing Approaches
Load testing reveals how your app performs under various usage scenarios. Stress testing identifies breaking points and failure modes.
Simulate realistic user loads on your backend services. If your app supports 10,000 concurrent users, test with 10,000 simulated users performing typical operations. Identify bottlenecks that appear only under load.
Test with realistic data volumes. An app that works perfectly with ten items might fail with thousands. Populate test databases with production-scale data to identify scalability issues.
Perform stress testing that exceeds expected loads to find breaking points. Understanding when and how your system fails helps you implement appropriate safeguards and graceful degradation.
Test edge cases like poor network conditions, intermittent connectivity, and high latency. Use network simulation tools to replicate 3G speeds, packet loss, and connection interruptions. We've found that many performance issues only surface under less-than-ideal network conditions common in real-world usage.
A/B Testing for Performance Improvements
A/B testing validates that optimization changes actually improve user experience and business metrics. Technical improvements don't always translate to better outcomes.
Create controlled experiments where some users experience optimized versions while others use the baseline. Measure differences in engagement, retention, conversion rates, and other business metrics.
Test performance changes independently rather than bundling multiple optimizations. This isolates which specific changes drive improvements and which don't matter.
Run tests long enough to achieve statistical significance. Short tests might show random variation rather than real differences. Consider seasonal patterns and user behavior cycles when determining test duration.
Monitor both technical metrics and business outcomes. An optimization that improves load time by 500ms matters only if it also improves retention or revenue. Focus on changes that deliver measurable business value.
Continuous Monitoring and Analytics
Performance testing shouldn't end at launch. Continuous monitoring detects regressions and reveals how real users experience your app.
Implement real user monitoring (RUM) that collects performance data from production apps. This reveals actual performance across diverse devices, networks, and usage patterns that testing environments can't fully replicate.
Set up automated alerts for performance degradations. Get notified immediately when key metrics like crash rate, load time, or API latency exceed acceptable thresholds. Quick detection enables faster responses before many users are affected.
Track performance trends over time. Gradual degradation often goes unnoticed without historical data. Regular performance reviews help identify slow regressions that creep in through incremental changes.
Segment performance data by device type, OS version, geographic region, and user demographics. Performance might be excellent for some user segments while problematic for others. Targeted optimization addresses the most impactful issues.
At Vohrtech, we implement comprehensive monitoring solutions that provide visibility into real-world app performance. This data-driven approach ensures optimization efforts focus on actual user pain points rather than theoretical concerns.
App Optimization Tools and Technologies
The right tools make performance optimization more efficient and effective. Modern development ecosystems offer sophisticated options for profiling, monitoring, and improving app performance.
Selecting appropriate tools depends on your platform, team expertise, and specific performance challenges. Combining multiple complementary tools provides comprehensive visibility into performance issues.
Performance Profiling Tools
Profiling tools identify performance bottlenecks by measuring how your app uses CPU, memory, network, and other resources during execution.
Xcode Instruments provides comprehensive profiling for iOS apps. The Time Profiler identifies CPU-intensive code sections, while Allocations tracks memory usage and detects leaks. Network profiling reveals API performance issues, and Energy Log shows battery impact.
Android Studio Profiler offers similar capabilities for Android development. CPU Profiler shows method execution times, Memory Profiler tracks allocations and garbage collection, and Network Profiler monitors data transfer. These integrated tools make performance analysis accessible without additional setup.
Chrome DevTools helps optimize hybrid and web-based apps. The Performance tab records runtime performance, identifying long tasks that block the main thread. Memory profiling detects leaks, while Network analysis reveals resource loading issues.
Monitoring and Analytics Platforms
Production monitoring platforms track real-world performance across your entire user base, revealing issues that testing environments miss.
Firebase Performance Monitoring automatically collects performance data from iOS and Android apps. It tracks app startup time, HTTP request latency, and custom traces you define. Integration is straightforward, requiring minimal code changes.
New Relic Mobile provides detailed performance analytics with customizable dashboards and alerting. It tracks crashes, HTTP errors, slow interactions, and custom metrics. The platform correlates performance with business outcomes, showing how speed affects conversion rates.
AppDynamics offers enterprise-grade monitoring with deep transaction tracing and root cause analysis. It's particularly valuable for complex apps with microservices architectures where performance issues span multiple systems.
Datadog provides unified monitoring across mobile apps, backend services, and infrastructure. This holistic view helps identify whether performance issues originate in the app or supporting systems.
Automation Tools for Ongoing Optimization
Automation ensures performance remains a priority throughout development rather than an afterthought before launch.
Integrate performance testing into CI/CD pipelines using tools like Lighthouse CI for web apps or automated profiling scripts for native apps. Fail builds that introduce significant performance regressions, treating performance as seriously as functionality.
Use automated code analysis tools that identify performance anti-patterns during code review. Tools like SonarQube flag inefficient algorithms, memory leaks, and other issues before they reach production.
Implement synthetic monitoring that regularly tests your app from various locations and network conditions. This catches performance degradations immediately rather than waiting for user complaints.
Consider performance budgets that set maximum acceptable values for key metrics like bundle size, load time, and memory usage. Automated checks enforce these budgets, preventing gradual performance degradation.
Conclusion
App performance optimization isn't a one-time project—it's an ongoing commitment to delivering excellent user experiences. The techniques covered in this guide provide a comprehensive foundation for building and maintaining high-performing applications.
Start by measuring current performance and identifying the biggest bottlenecks affecting your users. Implement optimizations systematically, testing each change to verify improvements. Focus on changes delivering the greatest impact on user experience and business metrics.
Remember that performance directly affects your bottom line through improved retention, higher conversion rates, and better user satisfaction. The investment in optimization pays dividends through increased revenue and reduced user acquisition costs.
Regular monitoring and testing ensure performance remains optimal as your app evolves. New features and growing data volumes can introduce performance regressions if you're not vigilant. Build performance considerations into your development process from the start.
At Vohrtech, we help businesses across Montreal and beyond optimize their applications for peak performance. Our evidence-based approach combines technical expertise with business understanding to deliver measurable results. Whether you need help diagnosing performance issues, implementing optimizations, or establishing ongoing monitoring, our team brings the experience and tools necessary for success.
Ready to transform your app's performance? Contact us to discuss how we can help you deliver the fast, responsive experience your users deserve. Visit our services page to learn more about our comprehensive web development and digital marketing solutions.